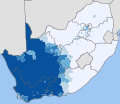
File:South Africa 2001 Afrikaans speakers proportion map.svg
Appearance

Size of this PNG preview of this SVG file: 689 × 600 pixels. Other resolutions: 276 × 240 pixels | 552 × 480 pixels | 882 × 768 pixels | 1,177 × 1,024 pixels | 2,353 × 2,048 pixels | 1,072 × 933 pixels.
Original file (SVG file, nominally 1,072 × 933 pixels, file size: 479 KB)
File history
Click on a date/time to view the file as it appeared at that time.
| Date/Time | Thumbnail | Dimensions | User | Comment | |
|---|---|---|---|---|---|
| current | 18:17, 3 April 2012 |  | 1,072 × 933 (479 KB) | Htonl | styles, color handling, color scheme |
| 10:46, 29 November 2010 |  | 1,072 × 933 (902 KB) | Htonl | remove grey "undefined" areas by drawing from municipal data | |
| 01:46, 2 October 2010 |  | 1,072 × 933 (925 KB) | Htonl | tweak | |
| 01:17, 2 October 2010 |  | 1,072 × 933 (838 KB) | Htonl | new approach, smaller filesize | |
| 20:17, 1 October 2010 |  | 1,072 × 933 (2.92 MB) | Htonl | use equal-area projection | |
| 19:15, 16 February 2010 |  | 1,000 × 786 (2.81 MB) | Htonl | tweak | |
| 20:56, 6 February 2010 |  | 1,000 × 786 (3.04 MB) | Htonl | == Summary == {{Information |Description={{en|1=Map showing the proportion of the South African population that speaks Afrikaans at home, from the 2001 census broken down to "Main Place" level. {{legend|#eff3ff|0–20%}} {{legend|#bdd7e7|20–40%}} {{lege |
File usage
No pages on the English Wikipedia use this file (pages on other projects are not listed).
Global file usage
The following other wikis use this file:
- Usage on eo.wiktionary.org
- Usage on it.wikipedia.org
- Usage on nl.wikipedia.org
- Usage on nrm.wikipedia.org
- Usage on pl.wikipedia.org

